Switzerland: Beverage Wholesale Market 2022
Swiss Market Analysis 2022 – The year in figures
Published by DIGITALDRINK, in SwissDrink Inside 2023.01
After the crisis is before the crisis – this is the impression that 2022 gave us in the meantime. Despite the many adversities and new challenges with which our politics, economy and not least our industry were confronted, we achieved a positive result in the end:
Total sales in 2022 are higher again than before Corona for the first time. We have compiled the most important and exciting developments for you.
The lifting of the measures to combat the pandemic at the end of May 2022 put many in a mood of optimism. But shortly afterwards, the economy and politics were faced with new challenges due to the war in Ukraine and the aftermath of the pandemic. Shortages of raw materials, delivery delays, price increases and staff shortages also caused problems for our industry.
It is therefore all the more pleasing that after a two-year “dry spell”, a recovery in beverage sales could nevertheless be observed. The mostly positive development trend observed this year continued in the fourth quarter. Although October and December were not quite able to catch up with the volume of 2019 (see Fig. 1). Nevertheless, the trend lines observed this year again follow the usual course and level from the times before Corona.
Total sales per month
Categories: Water, AfG with/without CO2, Juices, Functional Drinks & Beer | Quantities in (million) litres
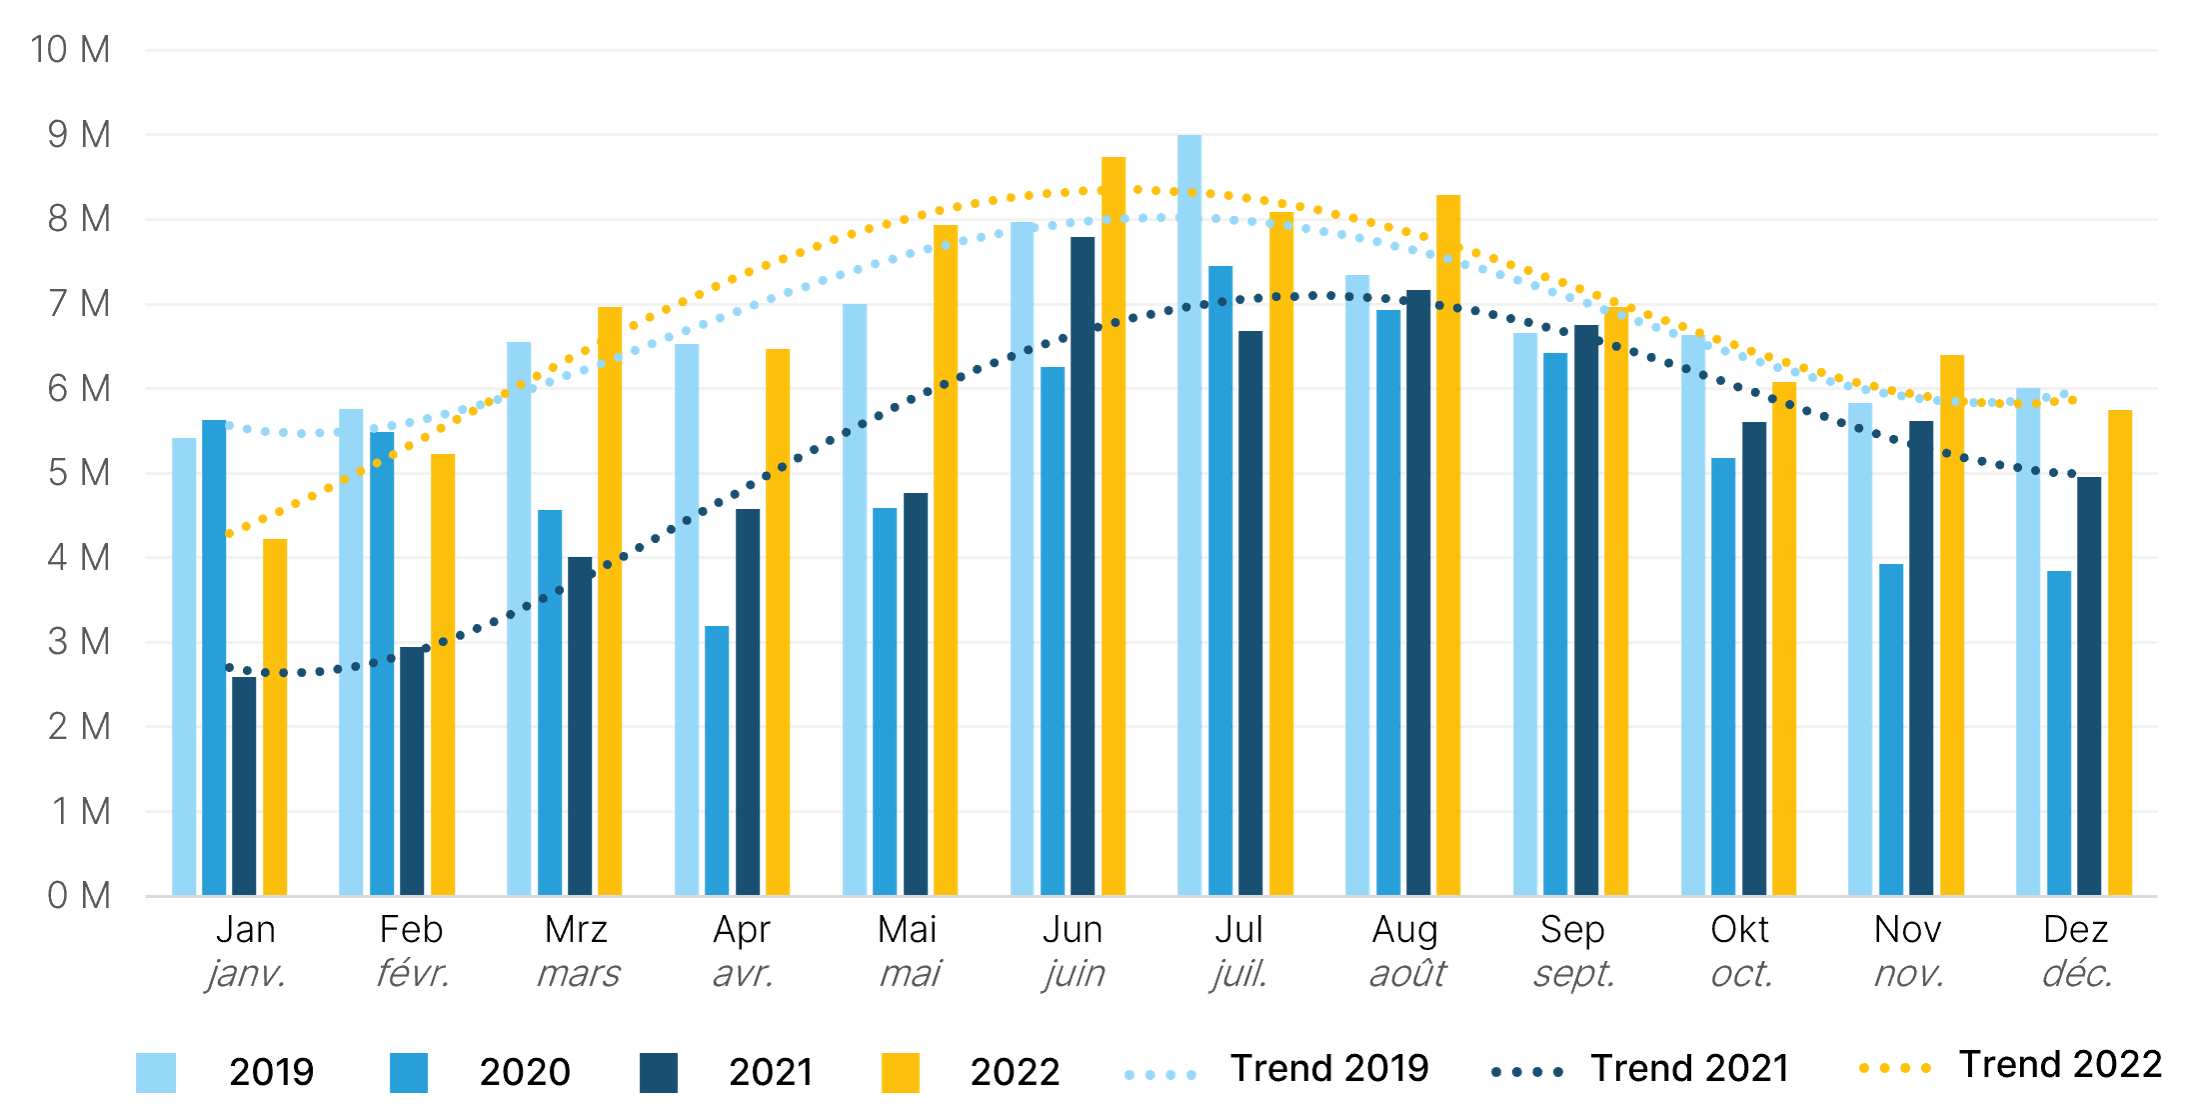
Figure 1: November with strong result; development trends again as before Corona
Thanks to an exceptionally strong November (+10% vs. 2019 / +14% vs. 2021), 2022 closes with a positive overall index of +0.6% compared to 2019. Compared to 2021, the increase is even +28% (see Fig. 2).
Overall development at the end of the year
Categories: Water, AfG with/without CO2, Juices, Functional Drinks & Beer | Quantities in (million) litres
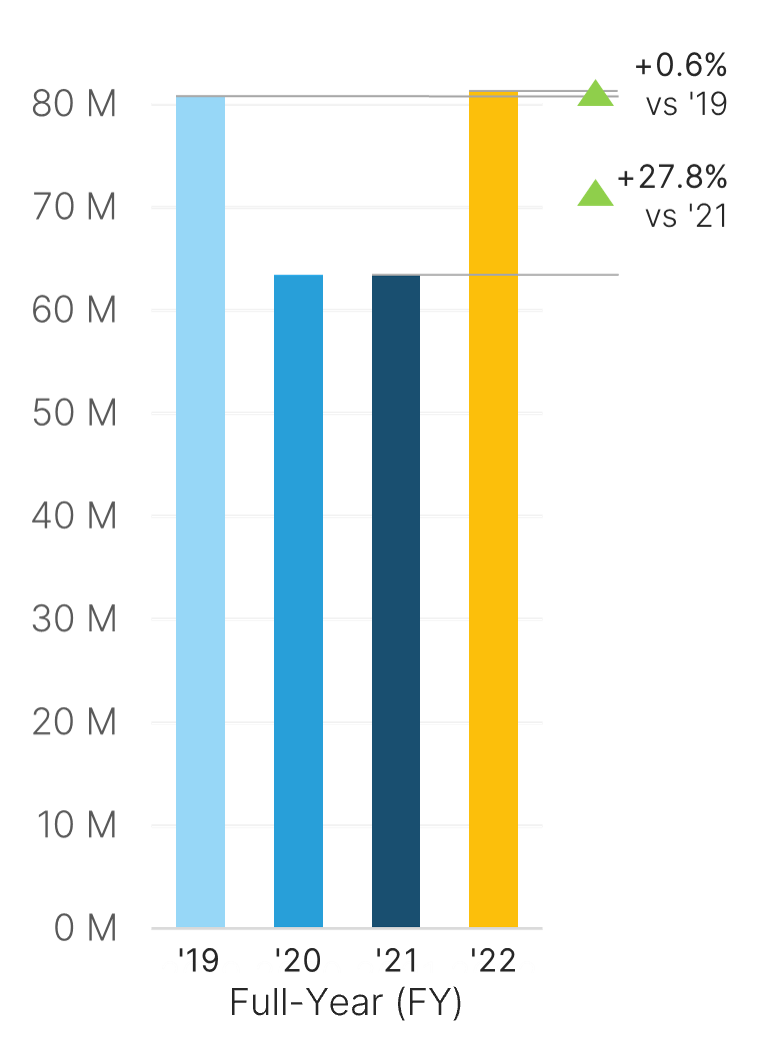
Figure 2: Total sales above pre-Corona level
Beverage Shops and Healthcare as positive drivers
The positive finish compared to 2019 continues to be driven by the positive results of the beverage shops and health institutions (see Fig. 3).
Development of total sales by distribution channel
Categories: Water, AfG with/without CO2, Juices, Functional Drinks & Beer | Quantities in (million) litres
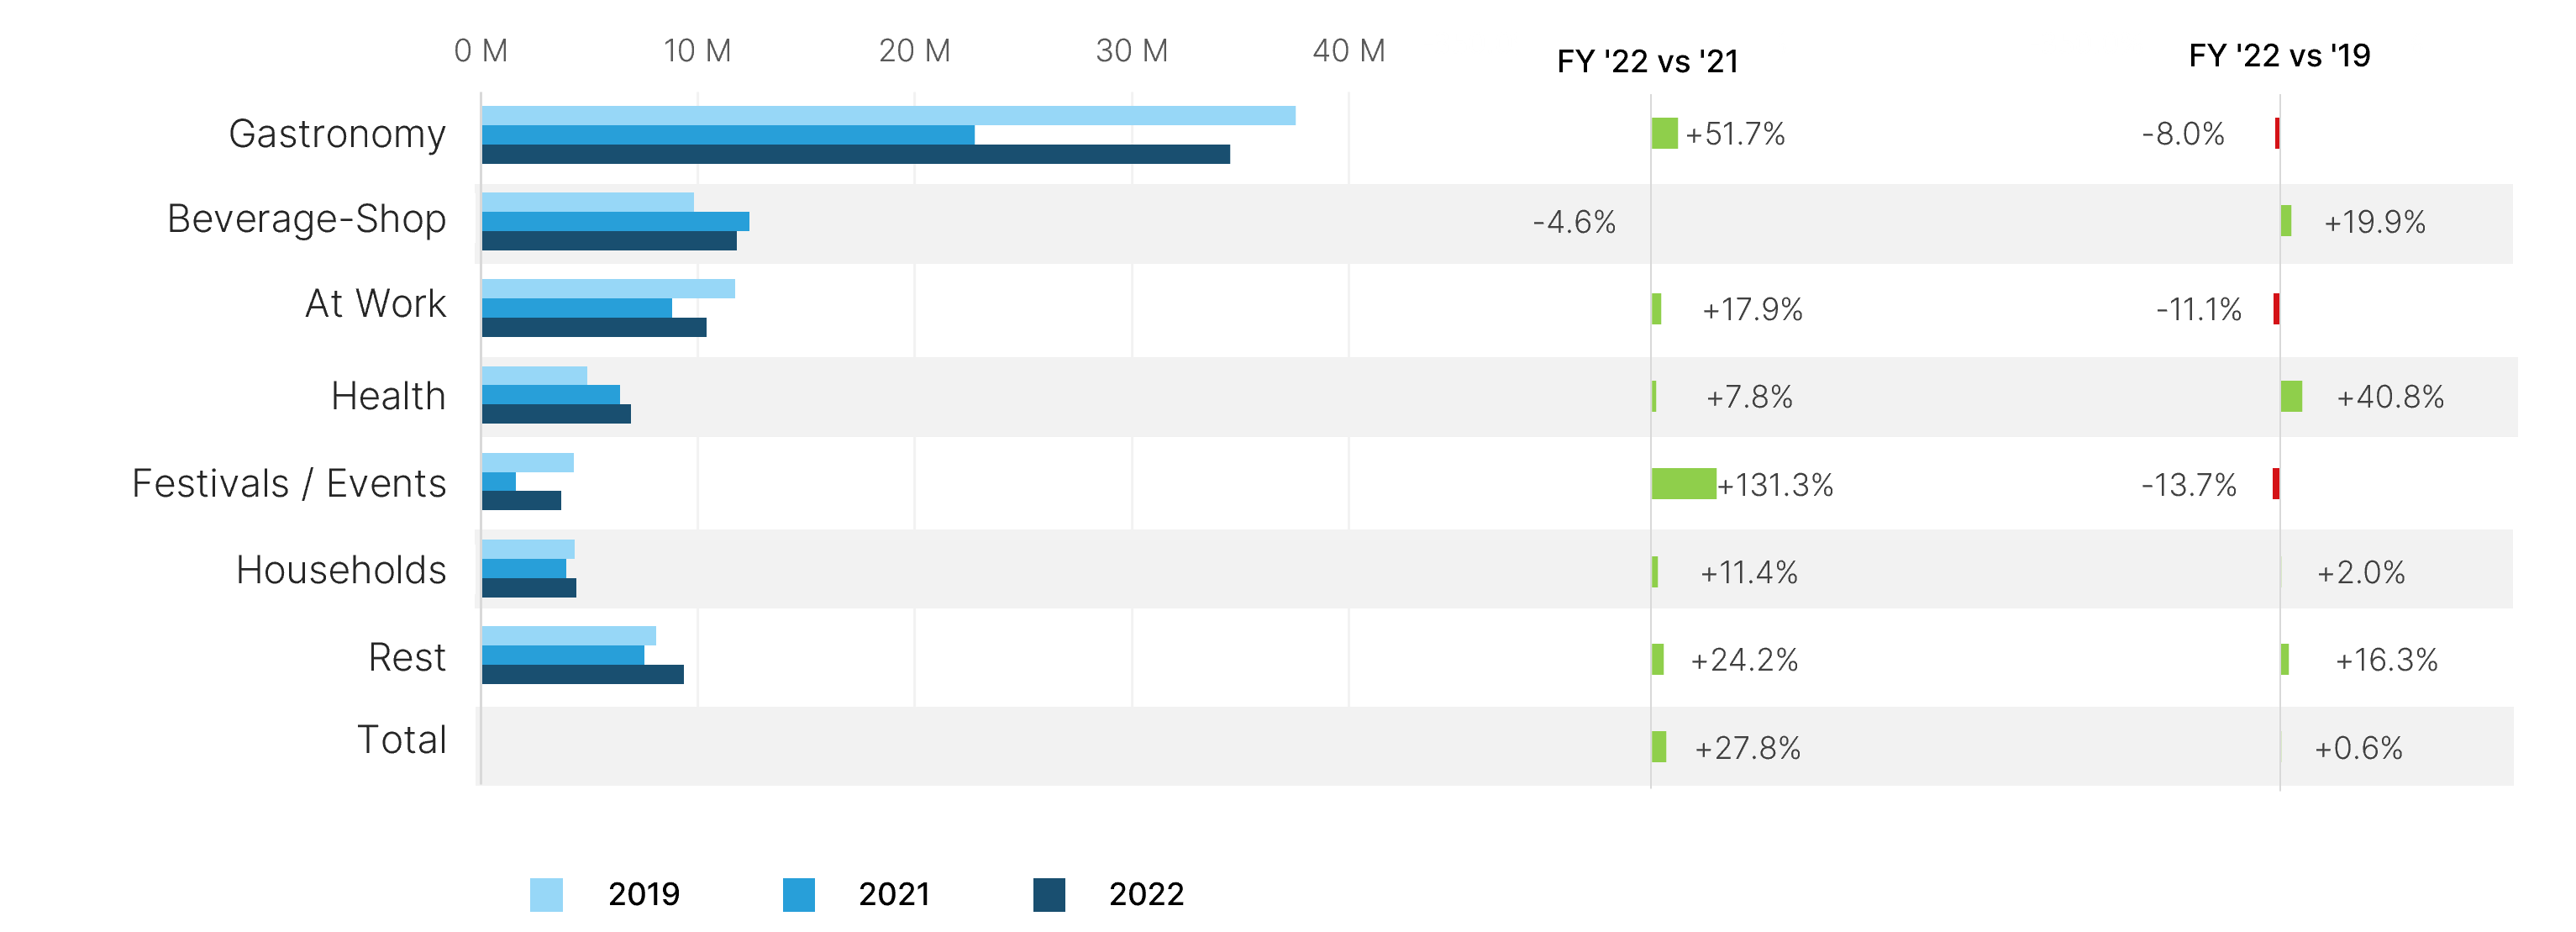
Figure 3: Beverageshops and Healthcare drive the positive overall result
The specialist stores were not quite able to keep up with the results from the previous year in the fourth quarter. Nevertheless, the additional Advent and festive shopping by consumers enabled an impressive increase of 20% compared to 2019.
As already observed at the end of Q3, hospitals, clinics and nursing homes developed positively compared to the previous year with +8% as well as to three years ago with an extraordinary +41%. Sales of mineral waters in particular increased strongly in this channel.
The recovery of the At Work channel with staff restaurants, canteens and catering due to reduced home office activity remains at about the same level as at the end of the third quarter.
Gastronomy suffers from the consequences of staff shortages
The development of gastronomy also remains mostly stable, but inhibits the positive annual index compared to 2019 with a decline of -8%. Compared to the previous year, sales recover by almost +52%.
Although the hospitality industry is again experiencing strong employment growth according to the BSF’s Q3 2022 Employment Barometer, the problem of staff shortages remains acute. Considering the challenges facing the industry, our sales performance can be interpreted as above average.
Mineral waters continue to grow above average
As already observed in the previous market analyses, mineral waters continue their positive development. Compared to 2019, the development is now over +5% (see Fig. 4). versus the previous year at +24%. Compared to before Corona, sales are significantly higher, especially via health institutions (+46%) and beverage pick-up markets (+29%).
Development of total sales by category
Quantities in (million) litres

Figure 4: Mineral water still above average compared to 2019
Softdrinks do not benefit from cash-and-carry market development
Non-alcoholic beverages with and without CO2 as well as unfermented juices suffered above-average losses compared to three years ago. They are the only categories that could not benefit from the increased sales of the cash-and-carry markets. In addition, they are relatively more affected by the losses in the at-work and event sector.
Beer sales improved slightly in the fourth quarter compared to 2019, resulting in a loss of less than 3%. Compared to the previous year, an increase of almost +30% is possible.
Functional beverages have steadily increased their growth from three years ago each quarter, reaching an index of +16%, compared to +34% last year.
Glass containers on the rise
A closer look at the non-alcoholic beverages reveals a pleasing trend towards glass packaging, which has increased by almost 7% compared to 2019, and by as much as 35% in the previous year (see Fig. 5).
Development of non-alcoholic beverages by packaging
Categories: Water, AfG with/without CO2, unfermented juices & functional drinks | Quantities in (million) litres
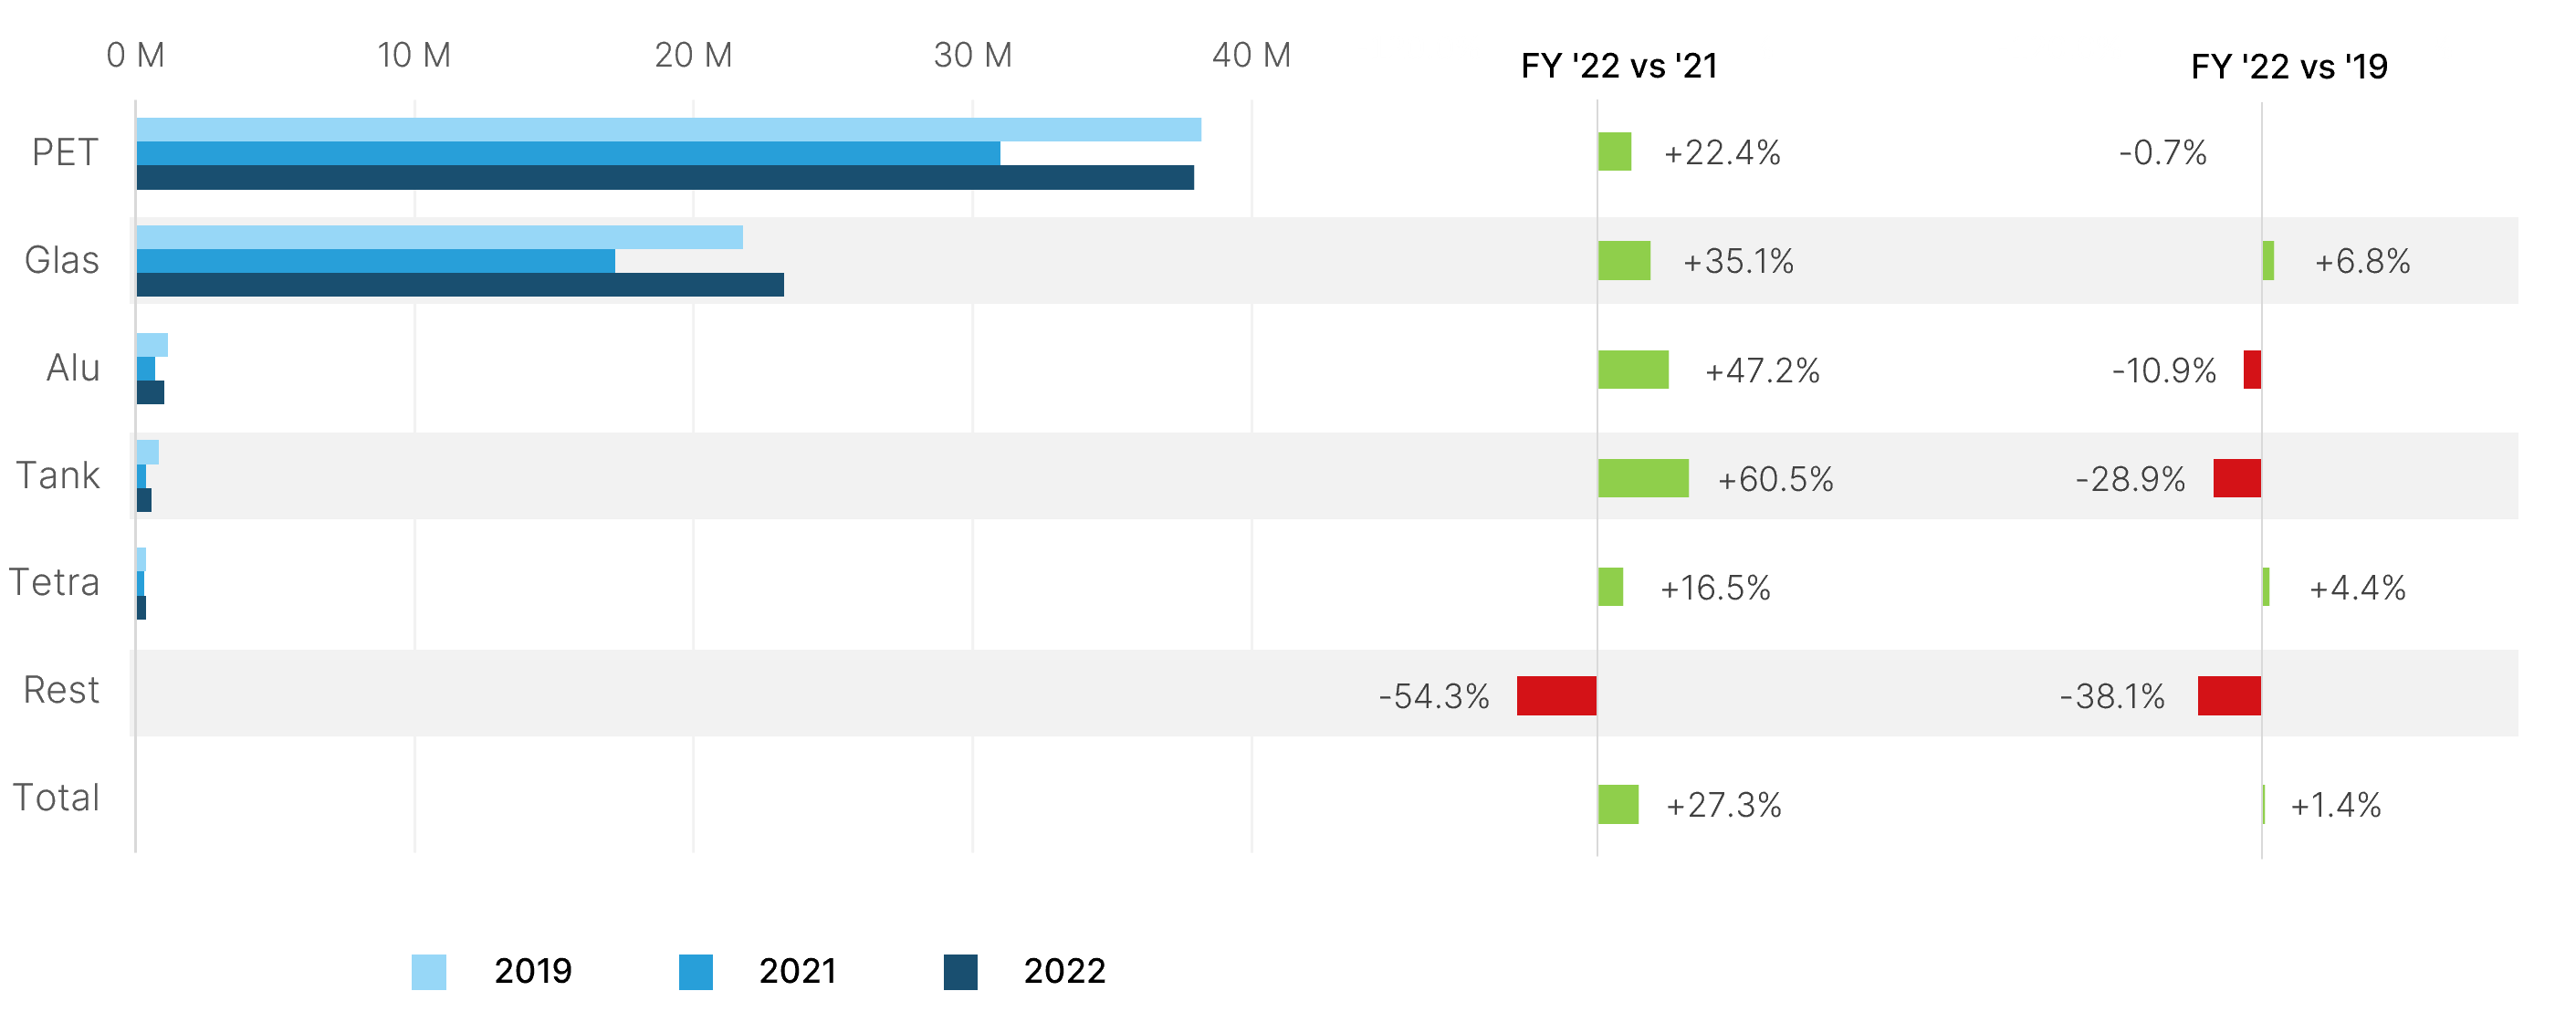
Figure 5: Trend towards glass packaging; PET at pre-Corona level
Beverages in PET packaging reach almost the same level as three years ago and increase at a slightly below-average rate of 22% compared to the previous year.
Although consumption from aluminium cans increases by over 47% compared to 2022, it is almost 11% lower at times before Corona. Especially in the at-work sector, 24% less is consumed from cans, while events even sell 40% less.
Drinks from tanks are consumed almost 29% less compared to 2019. The catering industry, the strongest sales channel for this packaging, recorded a decline of -17%, while only a quarter of the original volume is “tapped” at At Work.