REUSE Conference 2025 in Brussels: Europe focuses on reuse
![]() REUSE Conference 2025 in Brussels: Europe focuses on reuse
REUSE Conference 2025 in Brussels: Europe focuses on reuse
On November 6, 2025, the 10th REUSE Conference—one of Europe’s leading platforms for reuse and sustainable packaging systems—took place at the Fondation Universitaire in Brussels.
CEGROBB, the European umbrella organization for beverage wholesalers, hosted and co-organized the anniversary event together with Deutsche Umwelthilfe (DUH), Privaten Brauereien Bayern e.V., Pro Mehrweg, and the Reloop platform.
Under the theme “Unlocking the PPWR’s Full Potential,” the focus was on the implementation of the new EU Packaging Regulation (PPWR). It sets binding targets across Europe for waste prevention, reuse, and the circular economy—a key concern for CEGROBB and its member associations.
Solutions for a sustainable packaging future
In her opening speech, Barbara Metz from Deutsche Umwelthilfe (German Environmental Aid) emphasized that Europe must pursue an ambitious course to reduce packaging waste: “We have solutions—now we must implement them quickly and ambitiously,” she said. She pointed to the environmental costs of alternative single-use materials: Three billion trees are cut down every year for paper packaging. Since 1960 alone, global paper production has increased fivefold. Her message was clear: REUSE is the only alternative for reducing packaging waste.
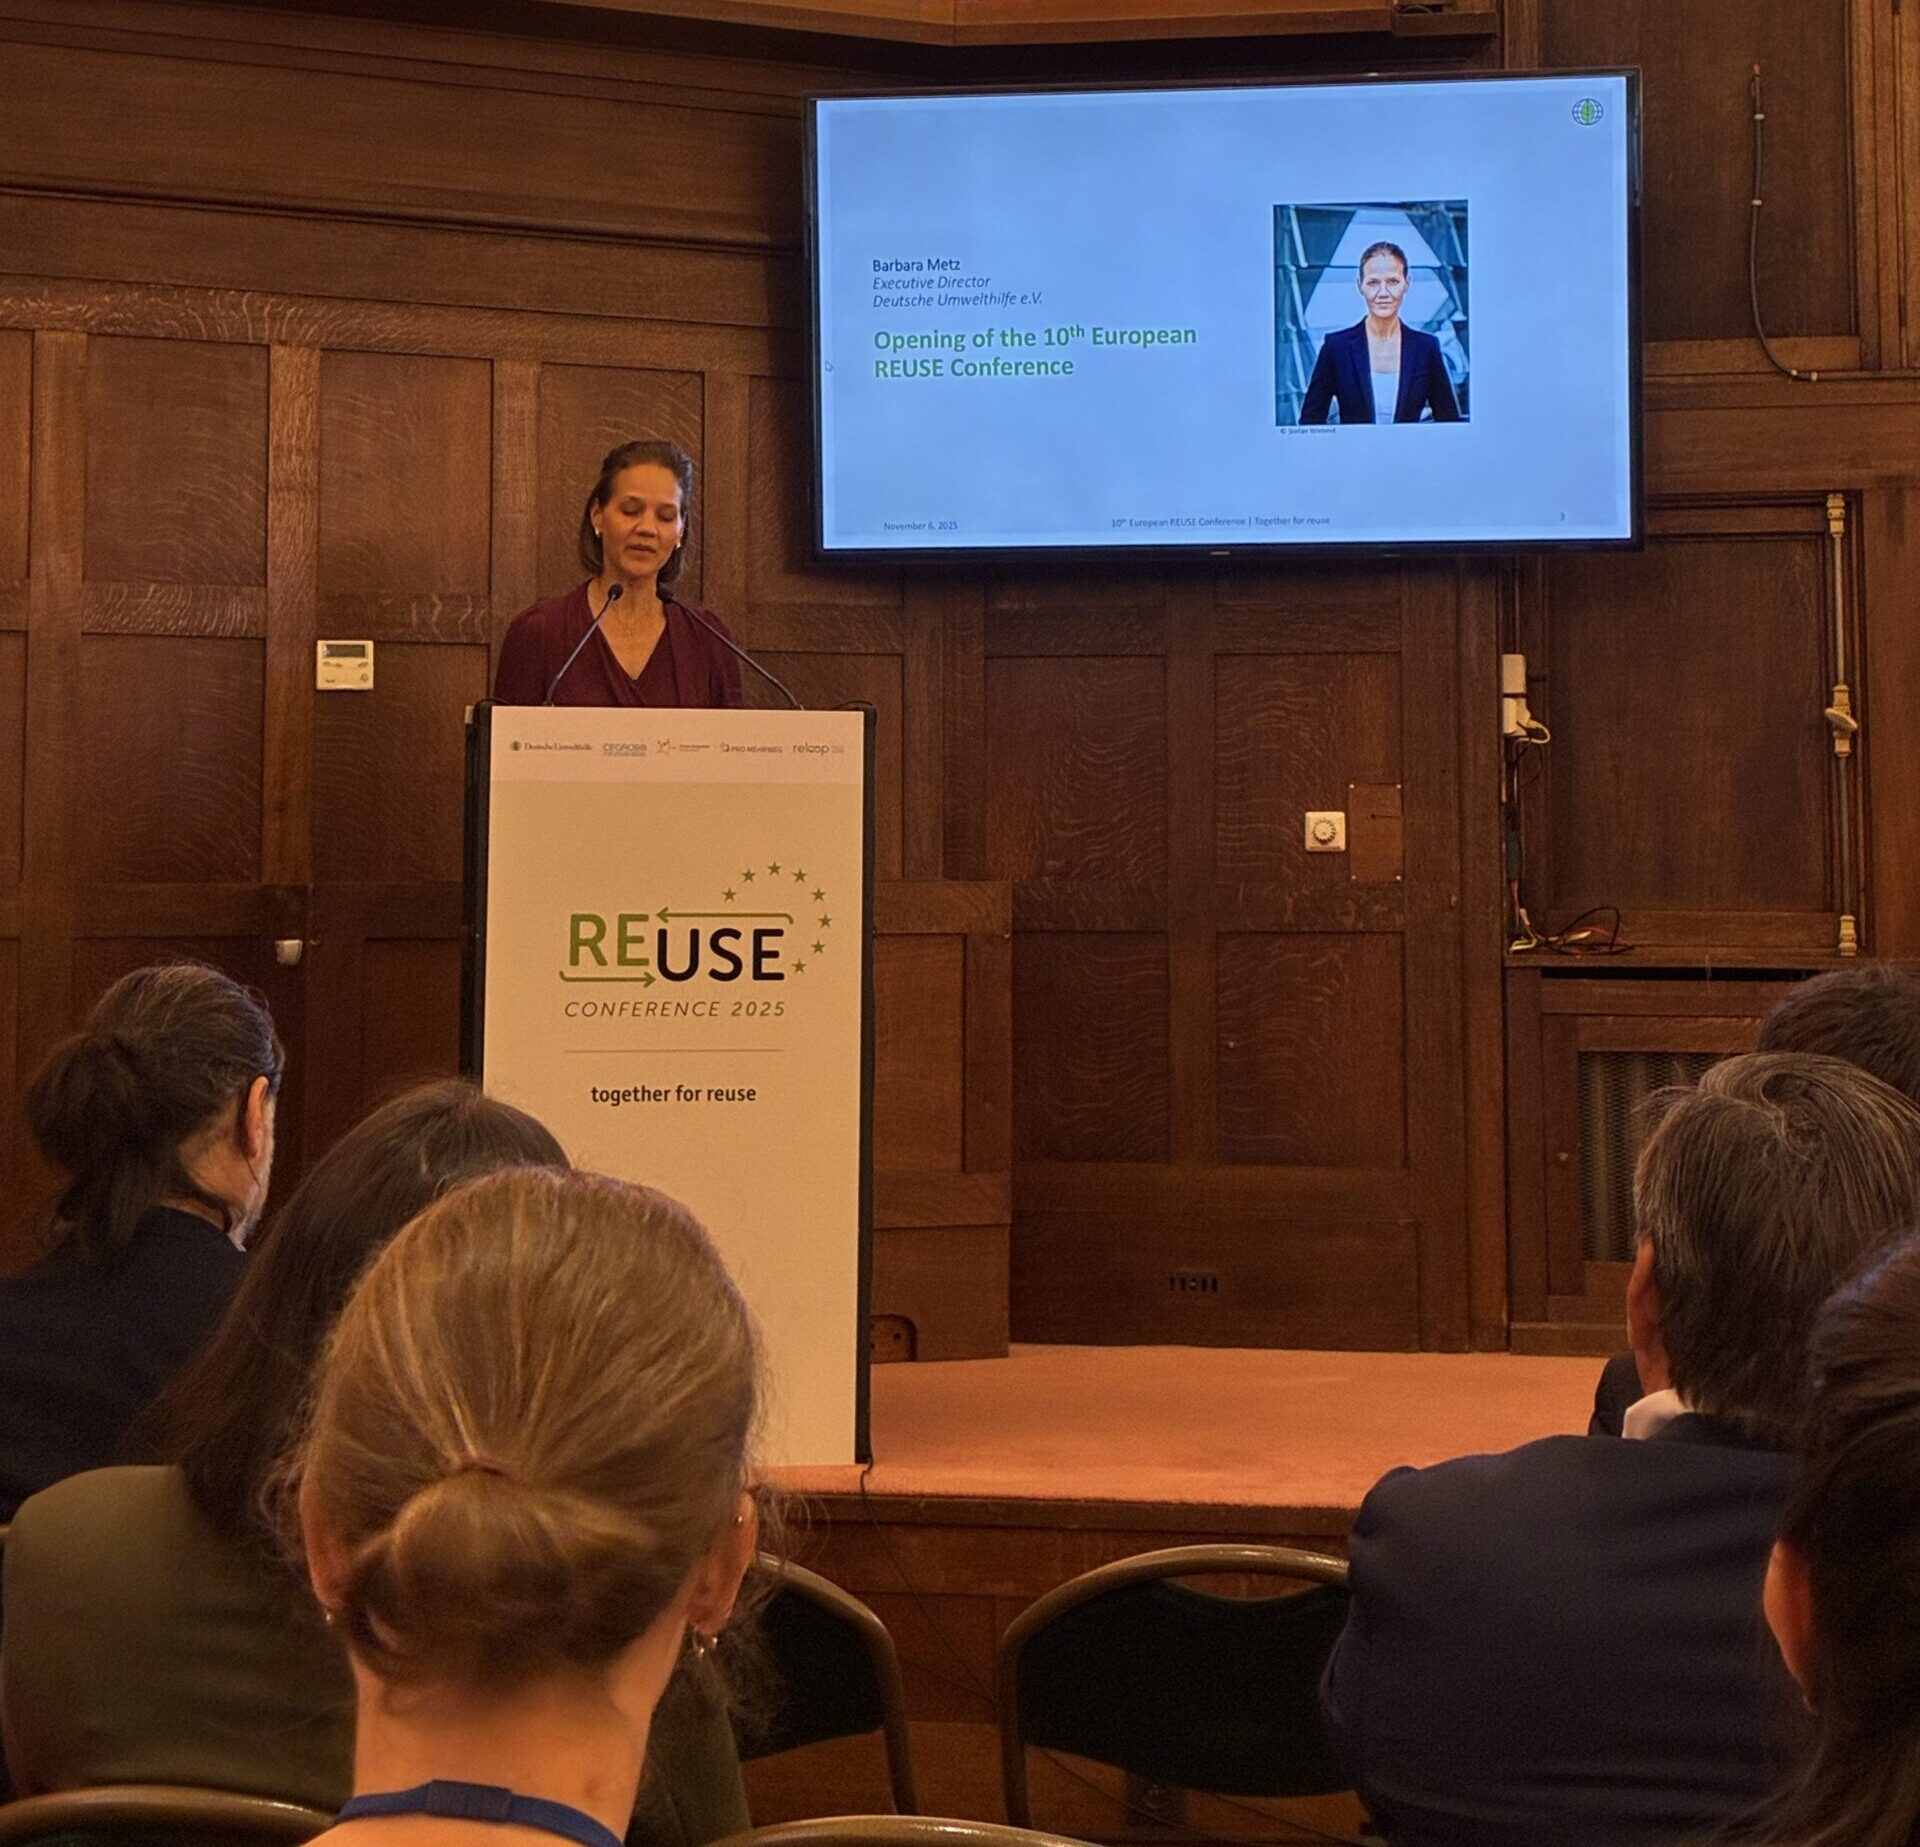
(Barbara Metz, Executive Director at Deutsche Umwelthilfe e.V.)
Best practices from member states
A highlight of the program was the presentation of successful national reusable systems—such as the Lithuanian deposit system, which has been operating with only 16 standardized bottle types since 2022 and achieves one of the highest return rates in Europe. Municipal initiatives from Lisbon also showed how cities can put reusables into practice. The discussions made it clear that fair economic conditions are needed for widespread reuse. CEGROBB has been campaigning for years for tax incentives and uniform EU rules that make reusable packaging competitive.
As with every REUSE conference, one of the absolute highlights is the presentation of the REUSABLE Award. Congratulations to the winners of the REUSEABLE Award 2025, Ardagh Group and the city of Aarhus, who impressed the audience with their commitment and innovative strength. They impressively demonstrated how climate and environmental protection can be achieved. In his laudatory speech, our president, Michel Haelterman, praised the city of Aarhus for its comprehensive reusable system in the to-go sector, which achieved 1.5 million refills in just one year.
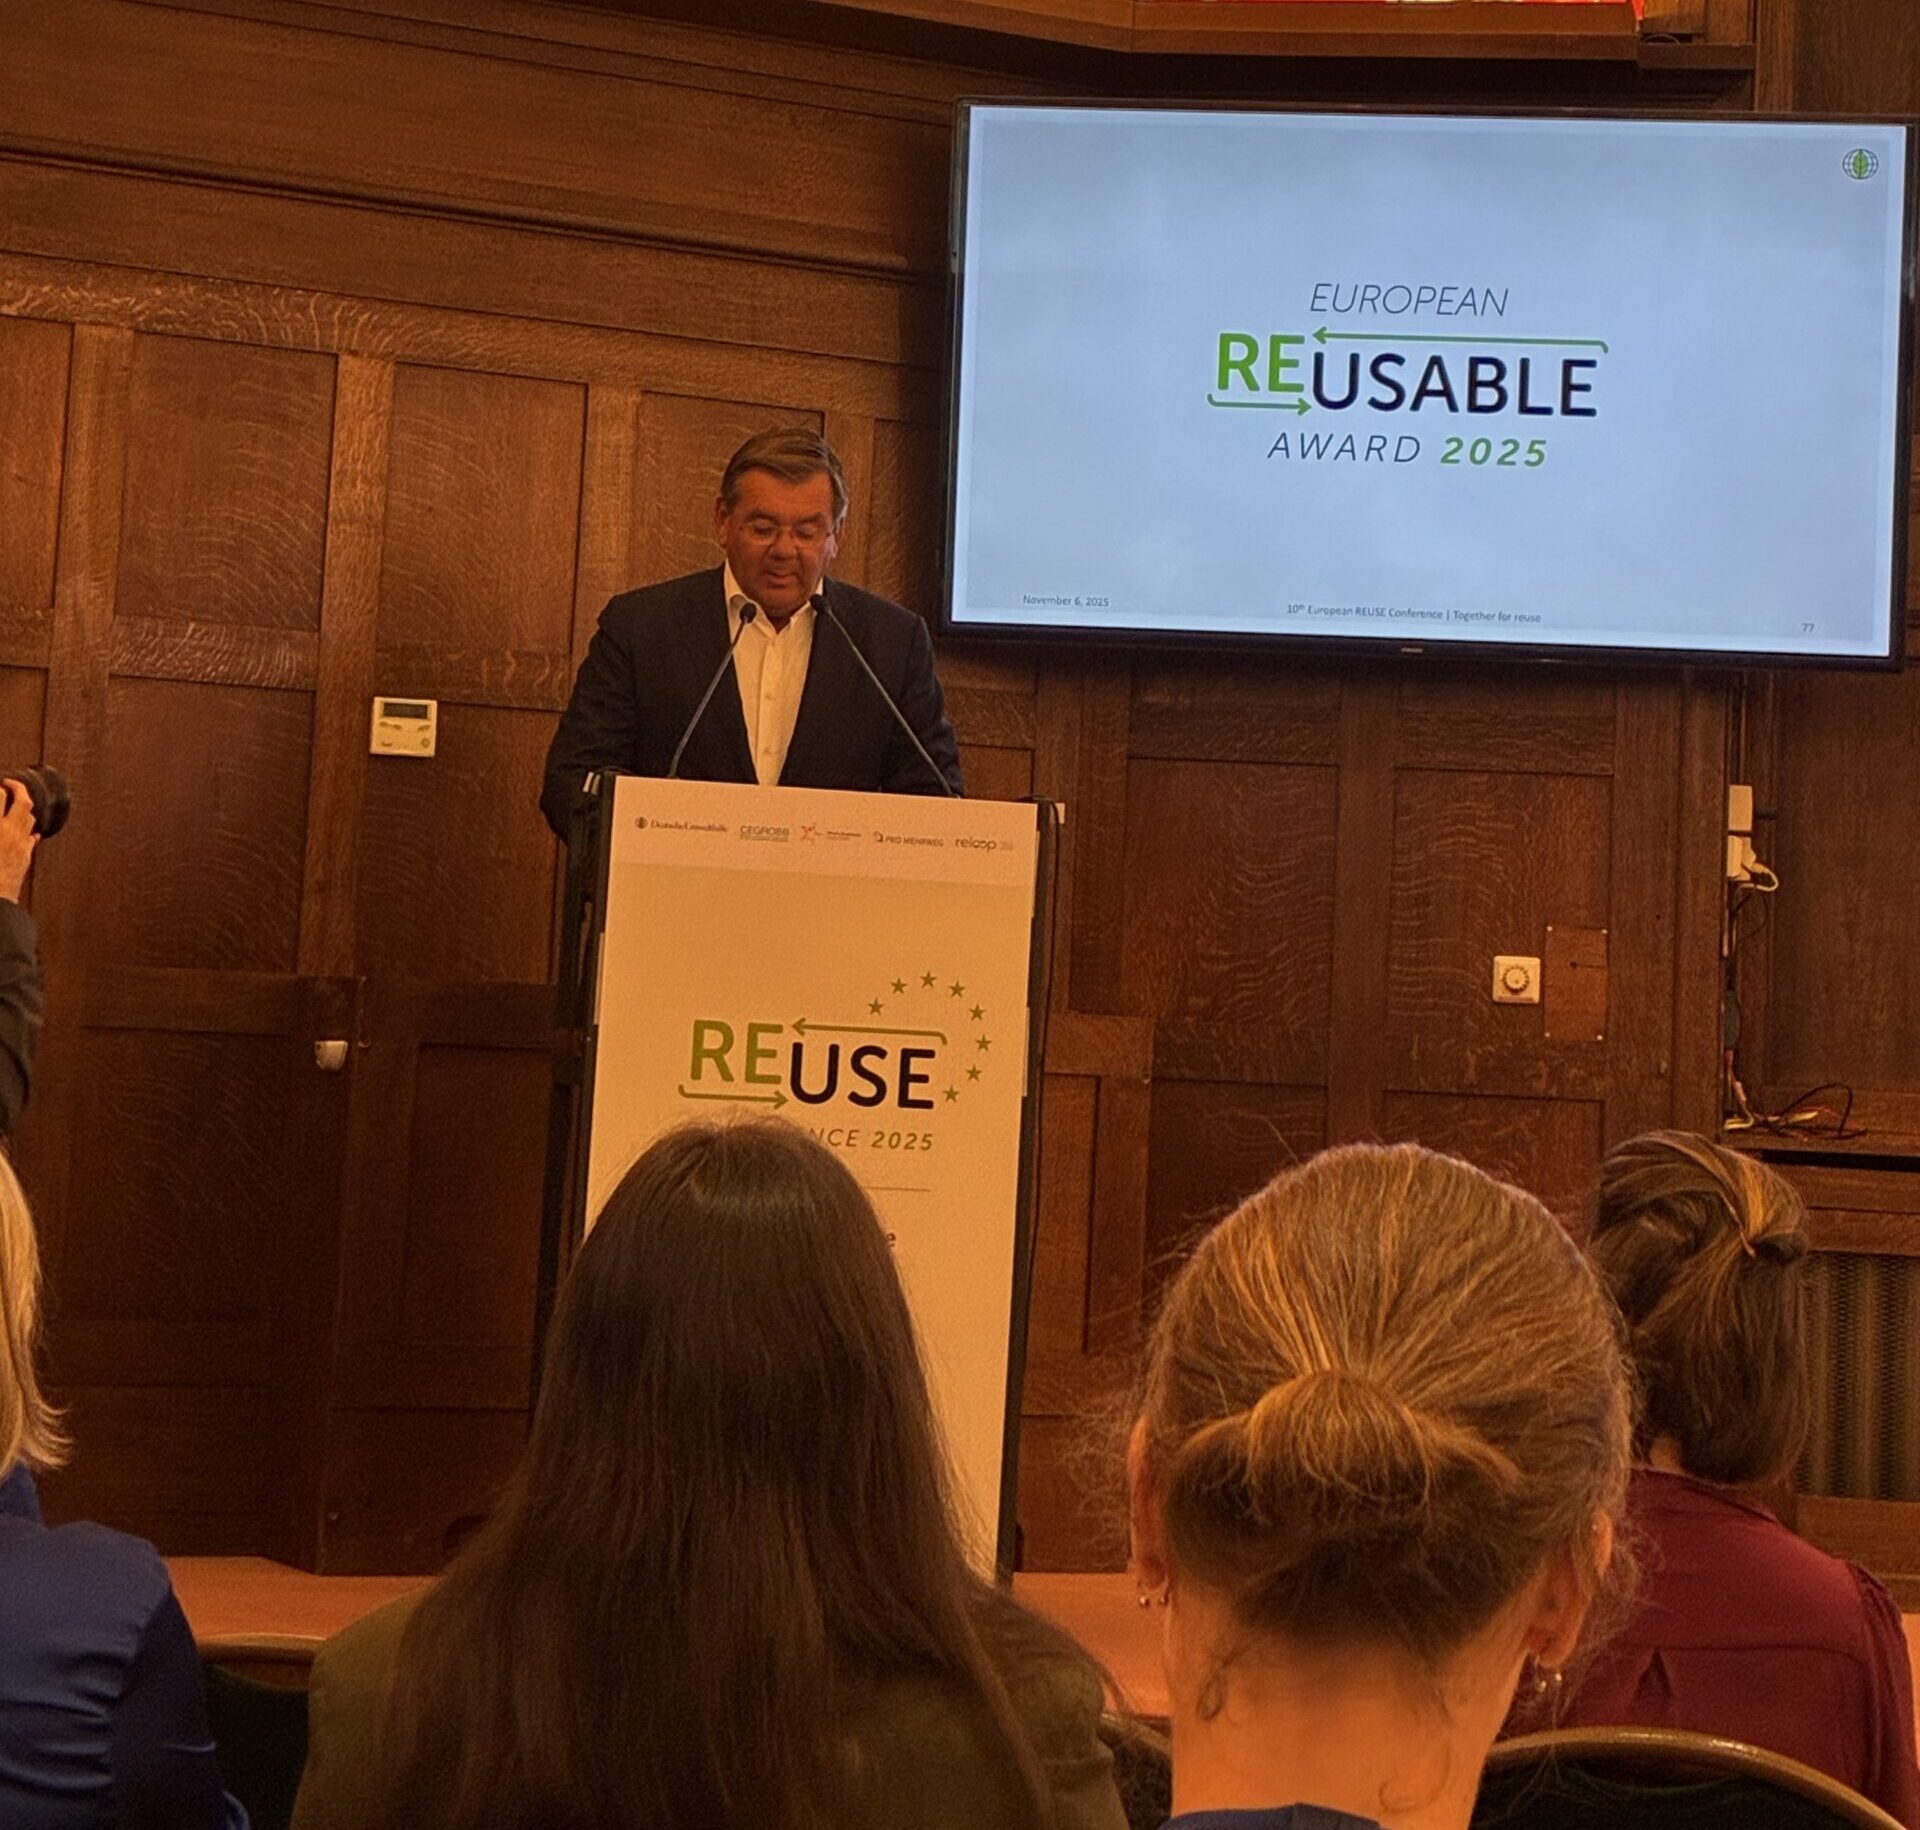
(Michel Haelterman, President of CEGROBB)
Following words with actions
The PPWR represents an important step forward at the European level—now it is time for implementation in the member states. The speakers unanimously called for ambitious national implementation measures. After ten years of REUSE conferences, one thing is clear: the reuse movement is growing – from Brussels to Aarhus. This year’s conference showed that solutions are available. The decisive factor now will be for politics and business to work together to resolutely promote the scaling up of reusable products.
We look back on a very interesting and informative event and are proud to support our members and industry partners in promoting reuse and the completion and implementation of PPWR.
Special thanks go to Deutsche Umwelthilfe for organizing this event and collaborating with Reloop and Private Brauereien Deutschland e.V.
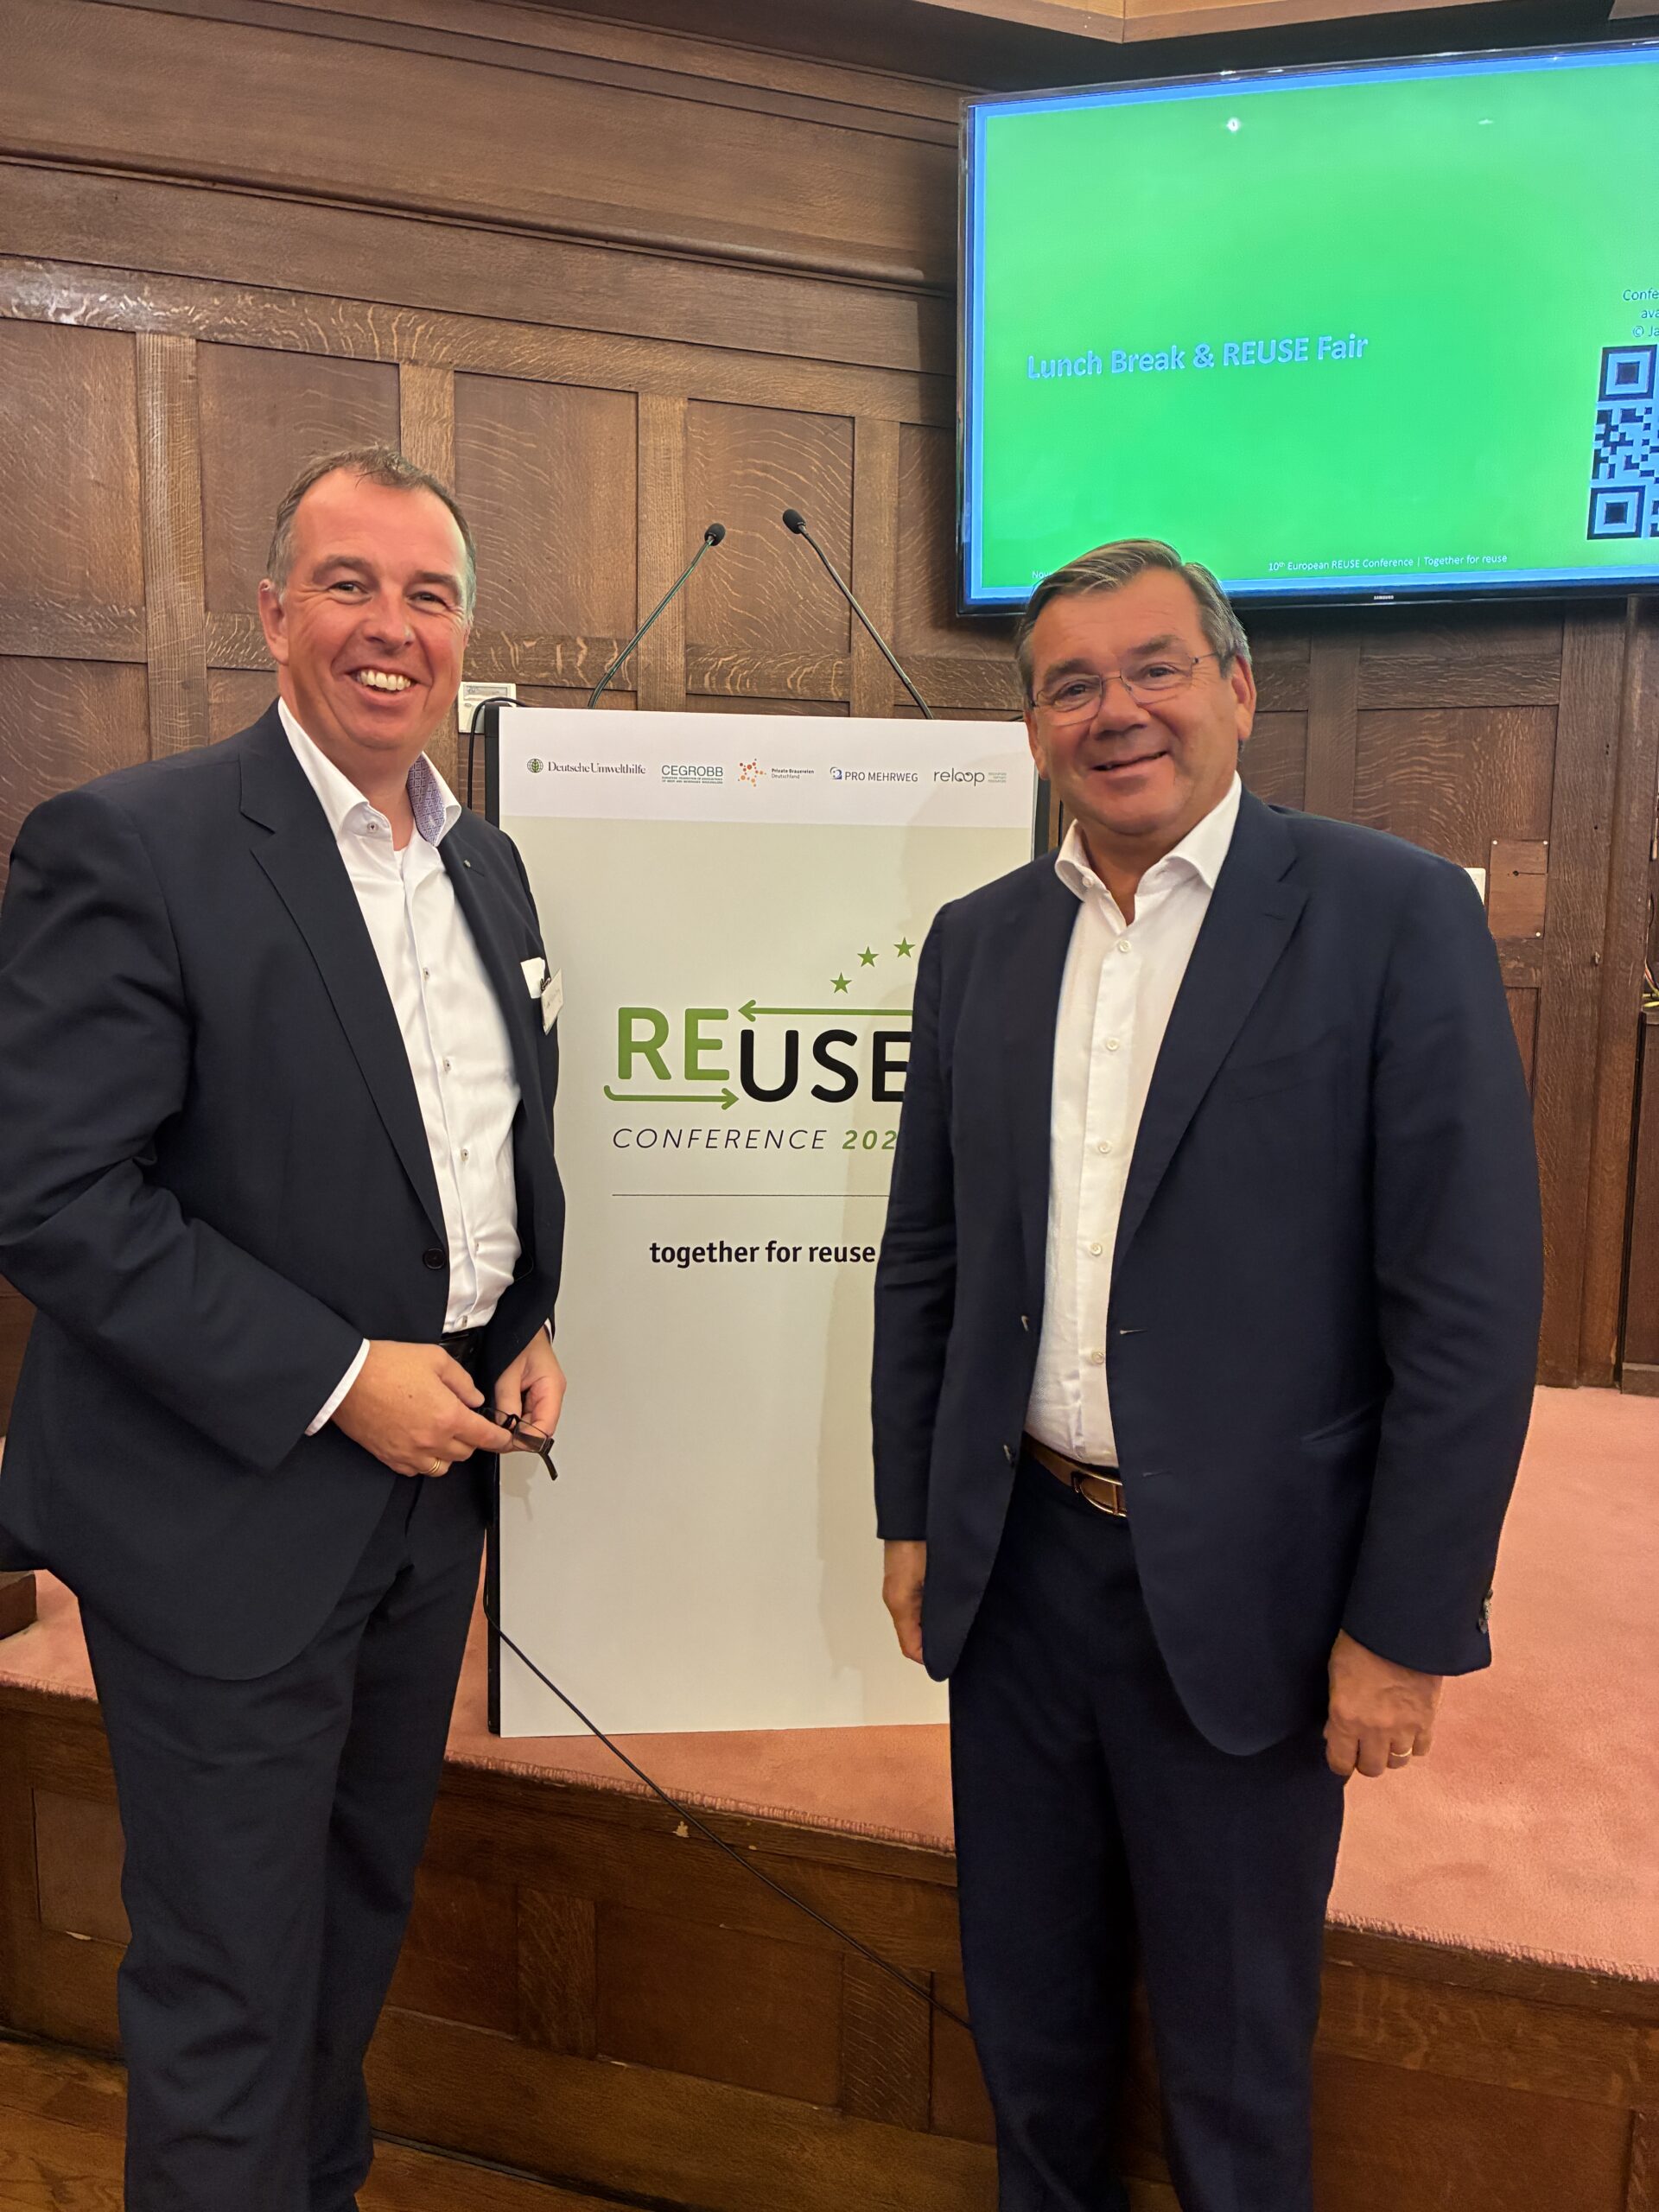
(from left to right, Dirk Reinsberg, Director General of BV-GFGH and Michel Haelterman, President of CEGROBB)
_____________________________________________________________
![]() REUSE-Konferenz 2025 in Brüssel : Europa setzt auf Wiederverwendung
REUSE-Konferenz 2025 in Brüssel : Europa setzt auf Wiederverwendung
Am 6. November 2025 fand in der Fondation Universitaire in Brüssel die 10. REUSE Konferenz statt – eine der führenden europäischen Plattformen für Wiederverwendung und nachhaltige Verpackungssysteme.
CEGROBB, der Europäische Dachverband der Getränkegroßhändler, war gemeinsam mit der Deutschen Umwelthilfe (DUH), den Privaten Brauereien Bayern e.V., Pro Mehrweg und der Reloop Plattform Gastgeber und Mitorganisator des Jubiläumsevents.
Unter dem Leitthema „Unlocking the PPWR’s Full Potential“ stand die Umsetzung der neuen EU-Verpackungsverordnung (PPWR) im Fokus. Sie schafft europaweit verbindliche Ziele für Abfallvermeidung, Wiederverwendung und Kreislaufwirtschaft – ein zentrales Anliegen von CEGROBB und seinen Mitgliedsverbänden.
Lösungen für eine nachhaltige Verpackungszukunft
Barbara Metz von der Deutschen Umwelthilfe betonte in ihrer Eröffnungsrede, dass Europa einen ehrgeizigen Kurs zur Reduzierung von Verpackungsmüll einschlagen müsse: „Wir haben Lösungen – jetzt müssen wir sie schnell und ambitioniert umsetzen“, sagte sie. Sie verwies auf die ökologischen Kosten alternativer Einwegmaterialien: Drei Milliarden Bäume werden jedes Jahr für Papierverpackungen gefällt. Allein seit 1960 hat sich die weltweite Papierproduktion verfünffacht. Ihre Botschaft war klar: REUSE ist die einzige Alternative, um den Verpackungsmüll zu reduzieren.
(Barbara Metz, Executive Director at Deutsche Umwelthilfe e.V.)
Best Practice aus den Mitgliedstaaten
Ein Highlight des Programms war die Vorstellung erfolgreicher nationaler Mehrwegsysteme – etwa das litauische Pfandsystem, das seit 2022 mit nur 16 standardisierten Flaschentypen arbeitet und eine der höchsten Rücklaufquoten Europas erreicht. Auch kommunale Initiativen aus Lissabon zeigten, wie Städte Mehrweg in die Praxis umsetzen können. In den Diskussionen wurde deutlich: Für eine flächendeckende Wiederverwendung braucht es faire wirtschaftliche Rahmenbedingungen. CEGROBB setzt sich schon seit Jahren für steuerliche Anreize und einheitliche EU-Regeln ein, die Mehrweg wettbewerbsfähig machen.
Wie bei jeder REUSE Konferenz ist eines der absoluten Highlights die Verleihung des REUSABLE Awards. Herzlichen Glückwunsch an die GewinnerInnen des REUSEABLE Award 2025, Ardagh Group und die Stadt Aarhus, die das Auditorium mit ihrem Engagement und ihrer Innovationskraft begeistert haben. Sie zeigten eindrucksvoll, wie Klima- und Umweltschutz gelingt. In seiner Laudation würdigte unser Präsident, Michel Haelterman, die Stadt Aarhus für ihr flächendeckendes Mehrweg-System im To-Go-Bereich, das in nur einem Jahr 1,5 Millionen Wiederbefüllungen erreichte.
(Michel Haelterman, President of CEGROBB)
Den Worten Taten folgen lassen
Mit der PPWR wurde auf europäischer Ebene ein wichtiger Schritt getan – nun geht es um die Umsetzung in den Mitgliedstaaten. Die Rednerinnen und Redner forderten einhellig, dass nationale Durchführungsakte ambitioniert gestaltet werden müssen.
Nach zehn Jahren REUSE Konferenz ist klar: Die Bewegung für Wiederverwendung wächst – von Brüssel bis Aarhus. Die diesjährige Konferenz zeigte, dass Lösungen vorhanden sind. Entscheidend wird nun sein, dass Politik und Wirtschaft gemeinsam die Skalierung von Mehrweg entschlossen vorantreiben.
Wir blicken auf eine sehr interessante und aufschlussreiche Veranstaltung zurück und sind stolz darauf, unsere Mitglieder und Industriepartner bei der Förderung von ReUse und der Fertigstellung und Umsetzung von PPWR zu unterstützen.
Ein besonderer Dank gilt der Deutschen Umwelthilfe für die Organisation dieser Veranstaltung und die Zusammenarbeit mit Reloop und Private Brauereien Deutschland e.V.
(from left to right, Dirk Reinsberg, Director General of BV-GFGH and Michel Haelterman, President of CEGROBB)
_____________________________________________________________